Test Scores: What do they mean? 2022 update.
Unless you have a background in statistics, interpreting your child’s language or speech test results can be a challenge. The purpose of this article is to explain what test scores mean in plain English.
To keep things simple, we’ve focused on the bare essentials. (If you want to know more about important concepts like standard deviations, confidence levels and z-scores, we’ve included links to some good “statistics 101” videos and other resources at the end.)
To understand your child’s test scores, you need to know the following:
A. Many speech and language assessment tests are standardised
During your child’s assessment, you might have noticed that the speech pathologist seemed to be reading off a script at times. That’s because they were.
If we want to compare your child’s results on a test to the results of other children on the same test, we need to make sure that the test is given to all children in the same way. As such, many tests are standardised. The test designers tell speech pathologists how to give the test in the standard (or acceptable) way. They set lots of rules, e.g. about:
- which parts of the test to give your child;
- where and when to start and end testing;
- whether we are allowed to repeat instructions or give clues; and
- the exact words to use to introduce and end tests.
Speech pathologists must follow these rules every time they do the test for the test results to be valid.
B. Some key standardised speech and language assessment tests are norm-referenced
If a standardised test is “norm-referenced”, it means that the test is designed to allow speech pathologists to compare your child’s results against the results of a group of “comparable” children who have taken the test in the same way. Usually, the comparison group is made up of:
- children the same age as your child; and/or
- children who have been at school for the same amount of time as your child.
Ideally, you want the test to have been given to – or “normed on” – many children at the same age-level and/or years of schooling as your child. You also want the test to have been given to a wide and representative range of children (we have more to say about this below).
Examples of common standardised, norm-referenced tests given to children by speech pathologists in Australia include the following:
- For preschoolers:
- For school-aged children and young adults:
- Clinical Evaluation of Language Fundamentals Australian and New Zealand Fifth Edition (CELF-5) for overall oral language development;
- Peabody Picture Vocabulary Test, Fifth Edition (PPVT) for vocabulary;
- Sutherland Phonological Awareness Test -Revised (SPAT-R) for phonological awareness; and
- York Assessment of Reading for Comprehension (YARC) – Australian Edition.
There are many others.
C. Standardised, norm-referenced tests have lots of limitations
Well-designed tests, like those mentioned above, are reliable and valid. This means they:
- measure what they say they measure; and
- produce consistent, stable results.
Your child’s test results tell us whether, on the day tested, your child’s performance on the test differed significantly from the performance of “comparable” children on the same test.
However, standardised, norm-referenced tests have several important limitations you need to know about. For example, standardised, norm-referenced speech and language tests like the ones listed above:
- give us just a ‘snapshot’ of your child’s performance: Even with a standardised test, your child’s performance may have been different if they were tested in a different place or time, or with a different speech pathologist;
- do not take into account lots of personal and environmental factors that can affect how your child interacts with others (Australian Institute of Health and Welfare, 2003; Filipek, 1999; National Research Council, 2001);
- do not provide a fair assessment for many children from culturally and linguistically diverse backgrounds (Kohnert, 2010), including children who are learning English as a second language and children learning more than one language;
- do not provide a fair assessment for children with Autism Spectrum Disorder (ASD), in part because of the largely social-pragmatic nature of ASD (see, e.g., Speech Pathology Australia, 2009);
- do not, on their own, provide a fair assessment for some children, e.g. with children with:
which can all affect a child’s performance on speech and language tasks; and
- do not take into account factors like how tired, ill, hungry or thirsty, or sugar-loaded they were, or whether they needed to go to the bathroom during the assessment; and
- do not provide a fair assessment for children who simply do not want to be tested for any reason.
Many standardised, norm-referenced tests include “decontextualised” tasks. This means that they test speech or language skills in isolation from their normal here-and-now, “real world” contexts. For example, many speech and language tests include cartoonish pictures (rather than real objects or photos) and do not take into account communication skills like gestures, and using contextual rules of thumb, which many of us use to supplement and clarify our understanding and meanings.
Test results don’t tell us how your child functions in the real world or how communication problems may affect his or her quality of life and participation. They do not explain why your child may have had challenges on a given assessment task.
These tests are geared to identifying clinically significant unsupported “impairments”, and “disorders”, rather than functional strengths with support.
Most significantly, standardised tests do not take into account your knowledge of your child’s strengths, interests, and capacities in the real world. You are the expert on your child. We’ve often just met.
Test results tell us nothing about your concerns, goals or priorities.
D. Standardised, norm-referenced test should never, on their own, be used to diagnose a communication disorder
For all the reasons set out in part C above, speech pathologists should never rely solely on test results to diagnose your child with a communication disorder, e.g. a Developmental Language Disorder or Speech Sound Disorder.
A thorough assessment process should include:
- a detailed parent/carer interview and questionnaire to understand your concerns and priorities, and to highlight factors that increase your child’s risk of communication challenges;
- behavioural observations of your child over time, ideally in more than one setting;
- criterion-referenced testing, looking at your child’s current knowledge and skills against set criteria (e.g. specific skills needed to cope with the school curriculum), without reference to the achievements or skills of others;
- an understanding of developmental norms, principles of effective therapy (and their limitations);
- natural speech and language sampling, e.g. in play or conversation;
- discourse level tasks, e.g. conversation, recount, story-telling, and explanatory tasks;
- an understanding of the child’s current and future participation, family and community supports; and
- the child’s own views!
With this additional context, standardised, norm-referenced testing can be one helpful source of information to help us to understand patterns of strengths and challenges, to spot significant discrepancies between different parts of speech and language, and to establish baselines for measuring progress. Government agencies and school systems may also require standardised, norm-referenced test results to determine eligibility for funding or other supports.
E. So what do my child’s assessment results mean?
In the next few sections, we will explain how to interpret standardised assessment test scores:
1. The assessment results table
After your child has been tested, your speech pathologist should provide you with a written report.
Test scores are often reported in the assessment results summary. They usually look something like this:
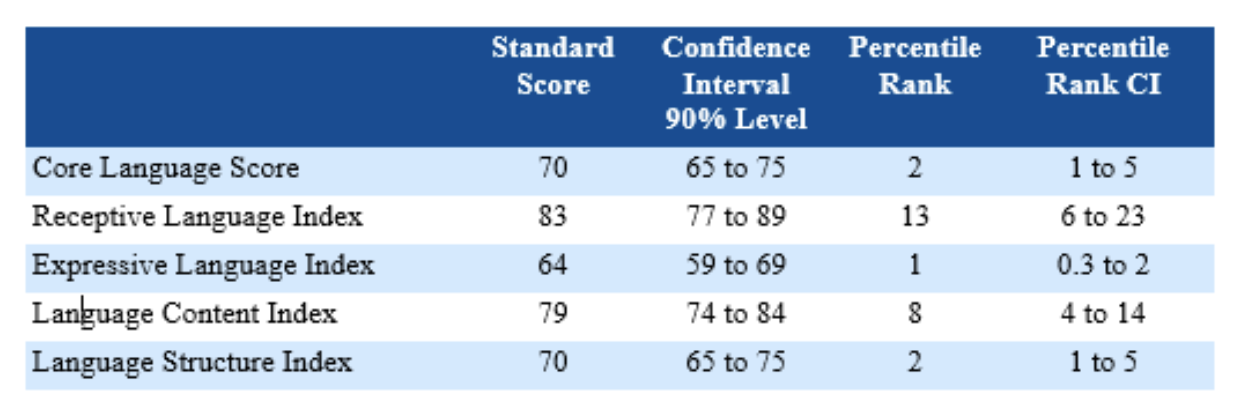
This table summarises the test results of a fictional child – let’s call her Child 1 – on the CELF-5.
The first thing to highlight is that standard scores of 86-114, inclusively, – i.e. between 85-115 – are within the normal range. We’ll explain standard scores shortly. But you can see that all of Child 1’s scores are below the normal range by looking at the following diagram:
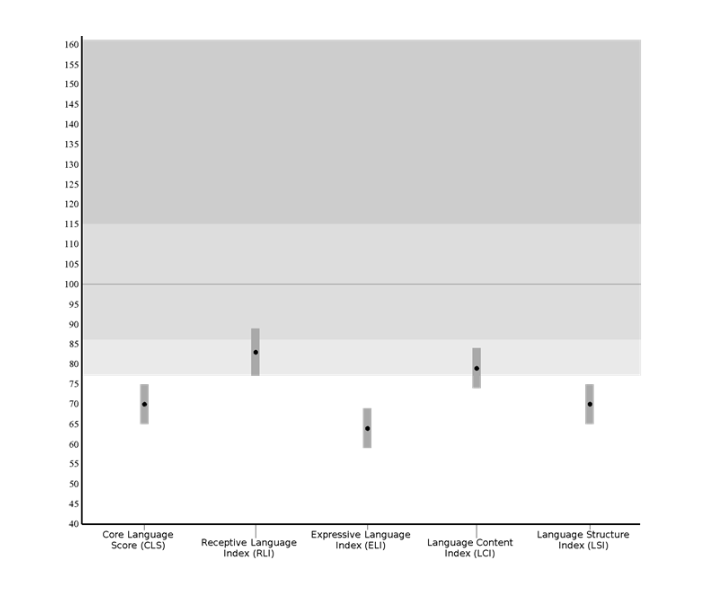
The medium-shaded area represents the normal range. All of Child 1’s scores are below the normal range.
2. What is a “confidence interval”?
Of course, Child 1 may have had an “off day” on the date of her assessment. So might her speech pathologist. We all make mistakes. A good speech pathology report will include not just the scaled scores, but confidence intervals, too.
A 90% confidence interval (like the one quoted in the table above) gives you a range of scores that you can be 90% sure contains the child’s “true” score. (That of course means there is a 10% chance, the true range is not within the range.)
3. Digging deeper: sub-test results
Behind the index results, it’s useful to look for patterns of strengths and weaknesses to help identify therapy priorities for children with communication disorders. Sub-test results provide more information about your child’s performance, and are often presented in a table like this:
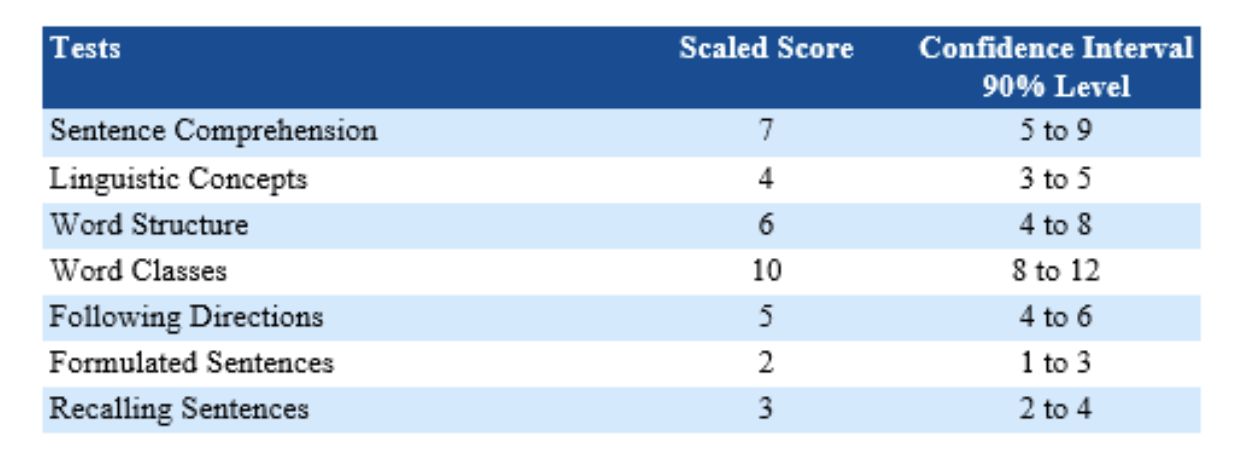
This table summarises Child 1’s results on several subtests of the CELF-5. A scaled score of 8 to 12 (inclusive) is within the normal range.
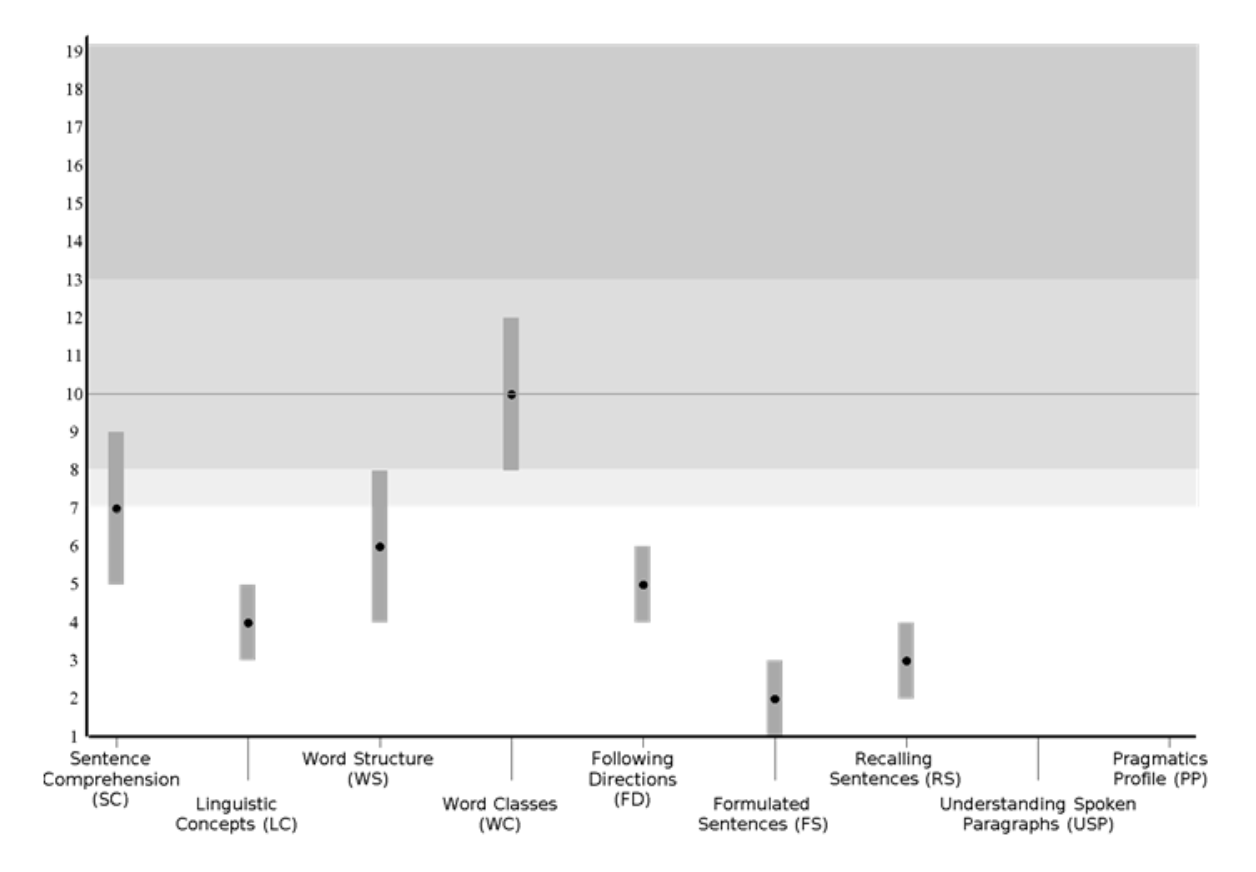
The medium-shaded area represents the normal range.
Your speech pathologist will give you information about what each of the subtests assesses. (This information is often presented in an Appendix to the assessment report.)
As you can see from the diagram, Child 1 scored below the normal range on almost all of the sub-tests. However, her test scores also suggest that she had areas of relative strength, such as her normal result on the Word Classes subtest. This is good to know for planning therapy.
4. Are there significant discrepancies between different test results?
Experienced speech pathologists will also want to know if there are any significant discrepancies or differences between different test results that might help explain aspects of the child’s language difficulties. Let’s look at Child 1’s results, for example:

Here, there are statistically significant discrepancies between Child 1’s receptive and expressive language index scores and between Child 1’s language content and structure index scores. For example, it appears that Child 1’s receptive language skills are significantly better developed than her expressive language skills. This might help us to understand and explain why Child 1’s parents and teachers both report that Child 1 gets very frustrated when trying to explain her needs to others at school and at home, and finds it difficult to recount her day.
5. Test scores and the normal curve
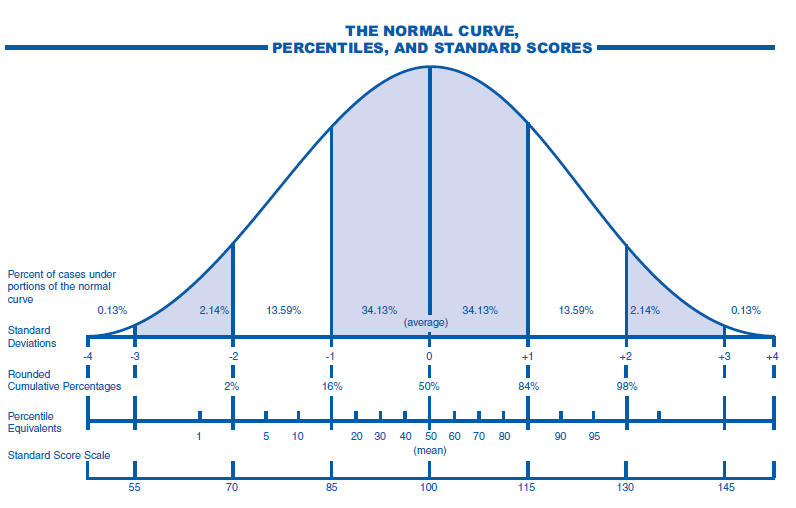
For most common norm-referenced, standardised tests (including the CELF-5), the number of children tested is so large that the scores of the people taking it form a bell-shaped or “normal” curve when plotted on a graph. This fact allows us to measure your child’s performance against children of the same age by taking your child’s raw scores and translating them into standard or scaled scores and percentiles.
A normal curve looks like this:
Source: http://www.linguisystems.com/pdf/testingguide.pdf
6. What types of scores are usually reported and what do they mean?
Sometimes (we don’t know why), speech pathologists report raw scores. These are simply the number of items your child answered correctly on the test. They don’t mean anything.
To report something useful, speech pathologists convert your child’s raw scores into standard scores and percentiles. To get a standard score, we use a scale. The scale sets the average score (or mean) for the test at a round number. For example, the standard Core Language Score in the CELF-5 (a measure of overall language performance) is based on a scale where the average is 100.
Look at the bottom line of the normal curve diagram just above, which shows a Standard Score Scale. In our example above, our fictional client (Child 1) achieved a standard score of 70. This is significantly less than our average standard score of 100: well below the average for children her age.
Let say another child (Child 2) achieved a Core Language Score standard score of, say, 130. Looking at the normal curve, we would see that this score is significantly above the average of 100.
Using a similar process, speech pathologists convert your child’s standard scores into percentile ranks. Percentile ranks tell you how well a student performed compared to the age-matched group of children in the sample. An average standard score of 100 translates to the 50th percentile. If your child has a standard score of 100, which is at the 50% percentile, he or she scored as well as or better than 50% of age-matched children tested in the sample.
Child 1 obtained a percentile rank of 2. This means that Child 1 scored as well as or better than just 2 percent of children the same age tested. Conversely, Child 2’s Core Language Score of 130 translates to the 98th percentile: Child 2 scored as well or better than 98% of children the same age.
So which standard scores and percentiles are within “normal limits”?
Using a scale where the average standard score is 100 (as in the CELF-5 normal curve), a standard score of 86-114 (i.e. between 85-115) is considered “within normal limits”. Scores within these ranges are considered “normal”. As you can see:
- “normal” encompasses a wide range of scores; and
- a standard score within normal limits does not necessarily mean your child achieved an average or higher-than-average score.
7. When do standard scores suggest below normal results?
Confusingly, different tests use different terms to describe levels or degrees of language or speech problems. As a rule of thumb, on a scale where 100 is the average (like the CELF-5):
- a standard score of 70, or less than 70, suggests a severe impairment;
- a standard score of 71-77 suggests a moderate impairment;
- a standard score of 78-85 suggests a mild impairment; and
- a standard score of 86-114 (inclusive) is within the normal range for the test.
On the normal curve diagram (above), you can see the percentile range equivalent for each of these standard score ranges. Remember, for the reasons set out in Part C and D, standard scores must be interpreted with caution and never in isolation from other assessment results. However, we can say that Child 1’s language skills warrant urgent further investigation.
8. Further resources on statistics
For some useful videos and information on standardised, norm-referenced tests, normal curves and basic statistics, please check out the links below:
- Statistics 101: A Tour of the Normal Distribution
- Practical Assessment, Research, and Evaluation | University of Massachusetts Amherst
- Normal distribution (Gaussian distribution) (video) | Khan Academy
F. Bottom line
In this article, we’ve:
- outlined what we mean by standardised, norm-referenced testing;
- provided examples of common tests used by speech pathologists in Australia;
- highlighted the many limitations of standardised, norm-referenced tests;
- argued that standardised, norm-referenced tests should never be used in isolation to diagnose speech, language or other communication disorders;
- explained how to interpret norm-referenced test scores; and
- provided links to look into the statistics of norm-referenced testing in more detail.
It’s your speech pathologist’s job to make sure you understand your child’s test results. If you don’t understand the results – or anything else in your child’s assessment report – just ask!
Related articles:
- Does my child have a language disorder? 6 questions speech pathologists should ask before assessment
- Lifting our game: using language sampling to improve language therapy
- To help teenagers with language challenges, we need to go beyond words and sentences
- What children with Developmental Language Disorder tell us about their relationships with peers – and what we should do in response
This article also appears in a recent issue of Banter Booster, our weekly round up of the best speech pathology ideas and practice tips for busy speech pathologists, speech pathology students and others.
Sign up to receive Banter Booster in your inbox each week:

Hi there, I’m David Kinnane.
Principal Speech Pathologist, Banter Speech & Language
Our talented team of certified practising speech pathologists provide unhurried, personalised and evidence-based speech pathology care to children and adults in the Inner West of Sydney and beyond, both in our clinic and via telehealth.


Leave a Reply